

Hello dear reader, hope you’re having a wonderful day, wherever you are! In this article we will explain what the Partial ROC (pROC) is in Machine learning in simple terms, provide code, and everything you need to fully understand and implement it!
So sit back, relax, and enjoy!
Introduction
When evaluating machine learning models, especially in domains where false positives are particularly costly, traditional ROC curves might not tell the complete story.
Enter Partial ROC (pROC) – a sophisticated metric that focuses on the most relevant portion of the ROC curve, providing a more nuanced evaluation of model performance in high-specificity regions.
What is Partial ROC?
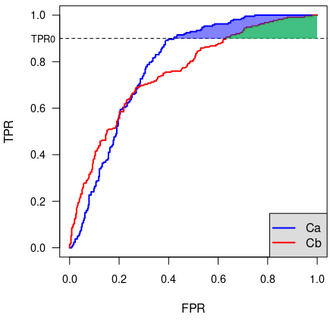
Imagine you’re developing a medical diagnosis system where false positives could lead to unnecessary, expensive, and potentially risky procedures. In such cases, you’re primarily interested in model performance when the false positive rate (FPR) is very low – say, below 5%.
This is where Partial ROC becomes invaluable.
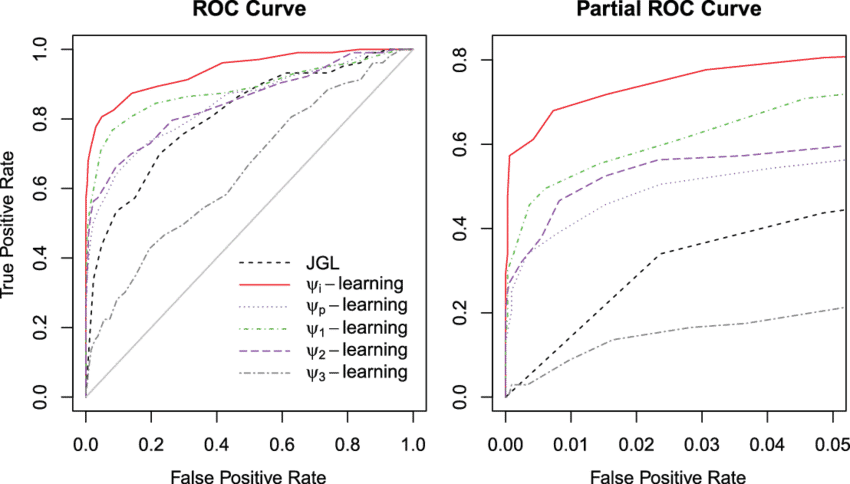
See how the example below focuses on the range from 0 to 0.05 of False Positive Range, in comparison to the full ROC we see on the left, it makes a lot more emphasis on this zone to the calculation.
Partial ROC analysis considers only a specific section of the ROC curve, typically defined by:
- A maximum acceptable false positive rate (FPR)
- The corresponding true positive rate (TPR) values within that range
The key advantage of pROC is its ability to:
- Focus evaluation on operationally relevant regions
- Provide more detailed analysis of high-specificity performance
- Better differentiate between models in critical operating ranges
Cool right?
Calculating Partial ROC
Awesome, so we know now why the pROC is cool, and why it can be of use. Lets see how the Partial ROC is calculated. The process is the following:
- Selecting a maximum FPR threshold (e.g., 0.2 for 20%)
- Computing the area under the ROC curve only up to this threshold
- Normalizing the result by the maximum FPR threshold
This gives us the Partial AUC (Area Under Curve), which we can standardize for easier interpretation.
When to Use Partial ROC?
Like we saw above, the Partial ROC becomes really relevant in domains where a high False Positive Rate (registers that we classify as 1 but that are actually 0s). Some of these domains are:
- Medical diagnosis systems
- Fraud detection
- Security applications
- Quality control systems
- Any domain where false positives are especially costly
Implementation Example
Now, lets see how to implement it!
Below, we will implement a Python function to calculate the Partial ROC and visualize it. The implementation includes both the calculation and plotting capabilities to help you understand and use this metric in your projects.
First you have the function to calculate the pROC, where we need to feed in the labels, just like in a normal RoC, and the Maximum FPR we want.
import numpy as np
import matplotlib.pyplot as plt
from sklearn.metrics import roc_curve
from typing import Tuple, Optional

def calculate_partial_roc(y_true: np.ndarray,
                         y_pred: np.ndarray,
                         max_fpr: float = 0.2
                         ) -> Tuple[np.ndarray, np.ndarray, float]:
    """
    Calculate Partial ROC curve and normalized partial AUC.

    Parameters:
    -----------
    y_true : np.ndarray
        True binary labels
    y_pred : np.ndarray
        Predicted probabilities or scores
    max_fpr : float, optional (default=0.2)
        Maximum false positive rate to consider

    Returns:
    --------
    fpr : np.ndarray
        False positive rates up to max_fpr
    tpr : np.ndarray
        Corresponding true positive rates
    partial_auc : float
        Normalized partial AUC
    """
    # Calculate full ROC curve
    fpr, tpr, thresholds = roc_curve(y_true, y_pred)

    # Find points within the specified FPR range
    mask = fpr <= max_fpr
    partial_fpr = fpr[mask]
    partial_tpr = tpr[mask]

    # Calculate partial AUC using trapezoidal rule
    partial_auc = np.trapz(partial_tpr, partial_fpr)

    # Normalize partial AUC
    normalized_pauc = partial_auc / max_fpr

    return partial_fpr, partial_tpr, normalized_pauc
This function will return the partial false positive rate, the partial true positive rate, and the new AUC.
Also, if you want to plot it, you can use the following code:
def plot_partial_roc(y_true: np.ndarray,
                    y_pred: np.ndarray,
                    max_fpr: float = 0.2,
                    title: Optional[str] = None
                    ) -> None:
    """
    Plot both full and partial ROC curves.

    Parameters:
    -----------
    y_true : np.ndarray
        True binary labels
    y_pred : np.ndarray
        Predicted probabilities or scores
    max_fpr : float, optional (default=0.2)
        Maximum false positive rate to consider
    title : str, optional
        Plot title
    """
    # Calculate full ROC
    fpr, tpr, _ = roc_curve(y_true, y_pred)

    # Calculate partial ROC
    partial_fpr, partial_tpr, partial_auc = calculate_partial_roc(
        y_true, y_pred, max_fpr
    )

    # Create plot, plot full ROC and partial ROC
    plt.figure(figsize=(10, 6))
    plt.plot(fpr, tpr, 'b-', alpha=0.5, label='Full ROC')
    plt.plot(partial_fpr, partial_tpr, 'r-', linewidth=2,
            label=f'Partial ROC (AUC = {partial_auc:.3f})')

    # Add reference line
    plt.plot([0, 1], [0, 1], 'k--', alpha=0.5)

    # Highlight partial ROC region
    plt.axvline(x=max_fpr, color='g', linestyle='--', alpha=0.5)
    plt.fill_between(partial_fpr, partial_tpr, alpha=0.3, color='r')

    # Customize plot
    plt.xlim(-0.01, 1.01)
    plt.ylim(-0.01, 1.01)
    plt.xlabel('False Positive Rate')
    plt.ylabel('True Positive Rate')
    plt.title(title or 'Partial ROC Analysis')
    plt.legend(loc='lower right')
    plt.grid(True, alpha=0.3)

    plt.show()
Best Practices and Considerations
So we’re almost experts on pROC now, lets finish by seeing some best practices. When working with this metric, you should always consider:
- Choose the FPR threshold based on domain requirements
- Consider using multiple thresholds for sensitivity analysis
- Compare standardized partial AUC values between models
- Validate results with domain experts
Summary
Partial ROC provides a focused lens for evaluating machine learning models in scenarios where traditional ROC curves might be too general.
By concentrating on specific operating regions, it offers more relevant insights for high-stakes applications where false positive rates must be carefully controlled.
As always, thanks so much for reading How to Learn Machine learning, have a great day, and keep learning!
Further Reading
Subscribe to our awesome newsletter to get the best content on your journey to learn Machine Learning, including some exclusive free goodies!
