

Learn the keys to evaluating Machine Learning models and improving their performance
Model Evaluation: Where to Start
Use this guide to choose your next evaluation step. Start with the data split and a baseline, then choose metrics that match the decisions your model supports. The comparison below focuses on classification; regression and forecasting require their own error measures and validation design.
Which Evaluation Metric or Method Do You Need?
| Your question | Guide | What it explains |
|---|---|---|
| Are my evaluation results trustworthy? | Cross-validation and leakage | Choose splits for time order or unseen groups; fit preprocessing within each training fold. |
| Which errors does my classifier make? | Confusion matrix in Python | Count true and false positives and negatives at a chosen threshold. |
| How many alerts are correct, and how many cases do I catch? | Precision and recall | Inspect the trade-off between false alarms and missed positives. |
| Can I summarise precision and recall? | F1 score | Combine them with a harmonic mean; still inspect each separately and consider error costs. |
| Does the model rank positives above negatives? | ROC curves and AUC | Compare ranking across thresholds; also check the operating region you will use. |
| How useful is the top-ranked group? | Lift curve | Measure positive concentration relative to the population at a fixed targeting budget. |
| How accurate are the predicted probabilities? | Brier score | Measure squared probability error; inspect a reliability diagram separately for calibration. |
| Why does training performance differ from validation? | Overfitting versus underfitting | Diagnose model fit alongside data quality, leakage and distribution changes. |
Read the linked tutorial for formulas, worked examples and implementation details. A useful evaluation often combines several rows: a valid split, a confusion matrix, a decision metric and a check of probability quality.
Put Model Evaluation into Practice: Six Python Tutorials
Ready to get hands-on, friends? Pick the question you are trying to answer below. Each tutorial includes runnable Python code and an example to help you interpret the result.
ROC AUC vs PR AUC. Choosing a ranking metric when positives are rare? Compare the curves with a worked example showing how class prevalence changes precision.
Classification threshold tuning in Python. Turn scores into decisions: choose a cutoff on validation data using error costs, then evaluate it on a separate test set.
Probability calibration in Python. Check whether predicted probabilities match observed frequencies. Read reliability diagrams and compare probability scores before and after calibration.
Learning curves in Python. Explore whether more training data might help. Compare training and validation errors as sample size grows, using linear and polynomial models.
Permutation feature importance in Python. Investigate which inputs a fitted model relies on, and see why correlated features can make individual importance scores misleading.
Bootstrap confidence intervals in Python. Put an uncertainty interval around model error and compare two fixed models using paired resampling. Learn when independent-row bootstrapping is appropriate.

Stay on track. Get the Roadmap.
Download the 90-Day Roadmap PDF + get weekly tips and resources to help you succeed
An introduction to evaluating Machine learning models
You’ve divided your data into a training, development and test set, with the correct percentage of samples in each block, and you’ve also made sure that all of these blocks (specially development and test set) come from the same distribution.
You’ve done some exploratory data analysis, gathered insights from this data, and chosen the best features for the task at hand. You’ve also chosen an evaluation metric that is well suited for your problem. Using this metric you will be able to iterate and change the hyper-parameters and configuration of your models in the quest to obtain the best possible performance.
After all this, you pre-process the data, prepare it, and finally train a model (lets say a Support Vector Machine). You wait patiently, and once it has finished training you dispose yourself to evaluate the results, which are the following:
Training set error: 8%
Development set error: 10%
How should we look at these results? What can we compare them against? How can we improve them? Is it possible to do it?
In this post we will answer all of these questions in an easy, accessible manner. This guide is not a debugging guide about setting breakpoints in your code or seeing how training is evolving. It is about knowing what to do when your model is trained and built, how to correctly asses its performance, and seeing how you could improve it.
A Recommended Order for Evaluating Your Model
1. Define the prediction and split. Decide what information will exist at prediction time and what the model must generalise to. Start with cross-validation and leakage.
2. Establish a baseline. Use a simple model or constant prediction appropriate to the task. Score the baseline and candidate on the same data.
3. Choose the metric. For classification, inspect the confusion matrix and precision and recall. Add Brier score when probabilities matter, or lift at your review budget when you act on a ranked shortlist.
4. Tune on validation data. Select the model, threshold and targeting budget without repeatedly consulting the final test set. Inspect mistakes and meaningful subgroups.
5. Report final performance. Evaluate the chosen approach on untouched test data. Report the baseline, sample size, metric values and limitations; assess uncertainty where practical.
Learn to evaluate models honestly. Read the free Starter Kit excerpt on test sets before deciding whether the €19 handbook is right for you.
What to compare our model against?
When we build our first model and get the initial round of results, it is always desirable to compare this model against some already existing metric, to quickly asses how well it is doing. For this, we have two main strategies for model evaluation in machine learning: Baseline models and Human-level performance.
Baseline models
A baseline model is a very simple model that generally yields acceptable results in some kind of task. These results, given by the baseline, are the ones you should try to improve with your new shiny machine learning model.
In a few words, a baseline is a simple approach towards solving a problem that gives a good enough result, but that should be taken as a starting point for performance. If you build a model that does not surpass baseline model performance on some data, then you should probably rethink what you are doing.
Lets see an example to get a better idea of how this works: In Natural Language Processing (NLP) one of the most common problems is that of Sentiment Analysis: detecting the mood, feeling or sentiment of a certain sentence, which could be positive, neutral or negative. A very simple model that can do this, is Naive Bayes: it is very transparent, fast on the training, and generally gives acceptable results, however, these are far from being optimal.
Imagine, you gather some labelled data for sentiment analysis, pre-process the data, train a Naive Bayes model and get 65% accuracy. Because we are taking Naive Bayes as a Baseline model for this task, with every further model we build, we should aim to beat this 65% accuracy. If we train a Logistic Regression and get 55% performance, then we should probably re-think what we are doing.
We might come to the conclusion that non-neural models are not fit for this task, train an initial Recurrent Neural Network, and get 70%. Now, as we have beaten the baseline, we can try to keep improving this RNN to get better and better performance.
Want to practise this hands-on? Chapter 13 of the ML Starter Kit, Evaluating a Model Honestly, walks you through baselines, test sets and evaluation with real Python code and outputs. New to ML? Start with the Free 90-Day Machine Learning Roadmap.
Human Level Performance
In the recent years, it has become usual for Machine Learning algorithms to not only produce excellent results in many fields, but to achieve even better results than human experts in those specific fields. Because of this, an useful metric to compare the performance of an algorithm on a certain task is Human Level Performance on that same task.
Lets see an example so that you can quickly grasp how this works. Imagine that a cardiovascular doctor can look at the health parameters of patients and diagnose with only three errors out of every one-hundred patients if the patient has a certain disease or not.
Now, we build a Machine learning model to look at these same parameters and diagnose the absence or presence of this previous disease. If our model makes 10 errors out of every 100 diagnoses, then there is a lot of room for improvement, (the expert makes 7 fewer errors for every 100 patients; he has a 7% lower error rate), however, if our model makes 1 failed prediction out 100, it is surpassing human level performance, and therefore doing quite well.
Human level performance: 3% error
Model test data performance: 10% error
Alright, now that we have understood these two metrics, lets progress in the analysis of the results of our Machine Learning models taking Human-level performance as the metric to compare against.
Comparing to Human level performance
Understanding how humans perform in a task can guide us towards how to reduce bias and variance. If you don’t know what Bias or Variance are, you can learn about it on the following post: Bias Variance Trade Off in Machine Learning.
Despite humans being awesome at certain tasks, as we have said, Machines can become even better than them, and surpass human level performance. However, there is a certain threshold that neither humans or Machine learning models can surpass: Bayes Optimal error.
Bayes optimal error is the best theoretical result that can be obtained for a certain task, and can not be improved by any kind of function, natural or artificial.
Imagine a data set composed of images of traffic lights where some images have an orientation such, and are so blurry that it is impossible, even for humans to get all the correct light colours from these images.

For this data set, Bayes optimal performance would be the maximum number of images that we can actually correctly classify, as some of them are impossible both for humans and machines.
For many tasks human level performance is close to Bayes optimal error, so we tend to use human level performance as a proxy or approximation of Bayes optimal error.
Lets see a more concrete example, with numbers, to get a complete grasp of the relationship between Human level performance, Bayes Optimal error, and the results of our models.
Understanding Human level performance and Bayes Optimal error
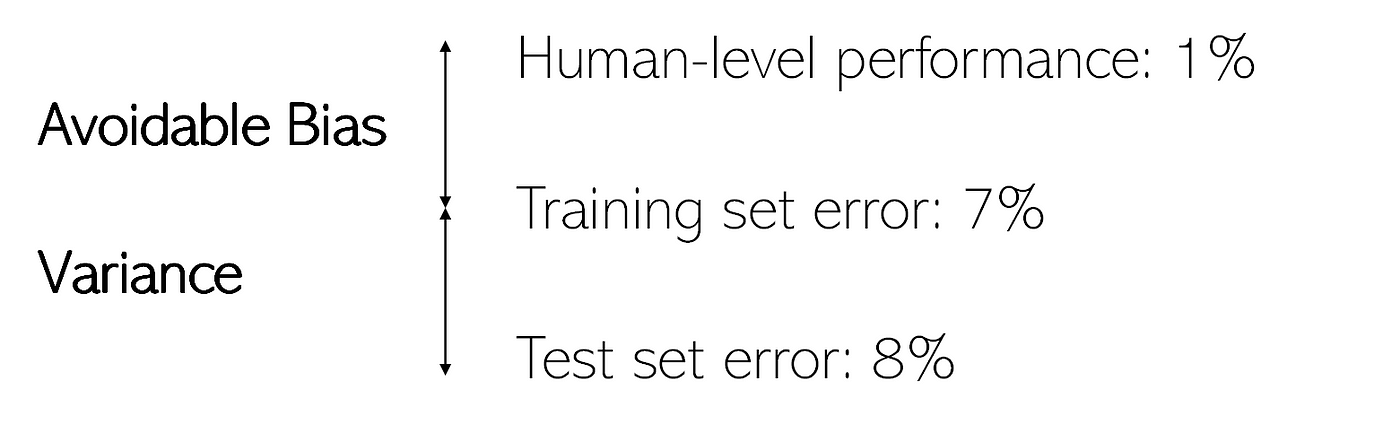
Imagine a medical image diagnosis task, where a typical doctor achieves a 1% error. Because of this, if we take Human level performance as a proxy for Bayes, we can say that Bayes error is lower or equal to 1%.
It is important to note that Human level performance has to be defined depending on the context in which the Machine Learning system is going to be deployed.
Imagine now that we build a Machine learning model and get the following results on this diagnosis task:
Training set error: 7%
Test set error: 8%
Now, if our Human level performance (proxy for Bayes error) is 1%, what do you think we should focus on improving? The error difference between Bayes Optimal error (1%) and our training set error (7%) or the error difference between training and test set error? We will call the first of these two differences Avoidable bias (between human and training set error) and the second one Variance (between train and test errors).
Once we know where to optimise, how should we do it? Keep reading to find out!
Evaluating Models in Machine Learning: Where and how to improve our Machine Learning models
Depending on these sizes of these two error differences (avoidable bias and variance) there are different strategies which we ought to apply in order to reduce these errors and get the best possible results out of our models.
In the previous example, the difference between human level performance and training set error (6%) is a lot bigger than the difference between training and test set error (1%), so we will focus on reducing the avoidable bias. If training set error was 2% however, then the bias would be 1%, and the variance would be 6% and we would focus on reducing variance.
If bias and variance were very similar, and there was room for improving both, then we would have to see which is least expensive or easier to reduce.
Lastly, if human level performance, training, and test error where all similar and acceptable, we would leave our awesome model just as it is.
How do we reduce each of these gaps? Lets take a look first and how to reduce avoidable bias.
Related: Overfitting vs Underfitting: how to diagnose your model.
Improving model performance: how to reduce Avoidable Bias in Machine Learning model evaluation
In our search for the best possible Machine learning model, we must look to fit the training set really well without producing over-fitting.
We will look at how to quantify and reduce this over-fitting in just a bit, but the first thing we have to try to achieve is an acceptable performance on our training set, making the gap between human level performance or Bayes error, and training set error as small as possible.
For this there are various strategies we can adopt:
- If we trained a classic Machine learning model, like a Decision Tree, a Linear or Logistic Regressor, we could try to train something more complex like an SVM, or a Boosting model.
- If after this we are still getting poor results, maybe our task needs a more complex or specific architecture, like a Recurrent or Convolutional Neural Network.
- When Artificial Neural Networks still don’t cut it enough, we can train these networks longer, make them deeper or change the optimisation algorithms.
- After all this, if there is still a lot of room for improvement, we could try to get more labelled data by humans, to see if there is some sort of issue with our initial data set.
- Lastly, we can carry out manual error analysis: seeing specific examples where our algorithm is performing badly. Going back to an image classification example, maybe through this analysis we can see that small dogs are getting classified as cats, and we can fix this by getting more labelled images of small dogs. In our traffic light example we could spot the issue with blurry images and set a pre-processing step for the data set to discard any images that don’t meet a certain quality threshold.

By using these tactics we can make avoidable bias become increasingly low. Now that we know how to do this, lets take a look at how to reduce Variance.
Improving model performance: how to reduce Variance.
When our model has high variance, we say that it is over-fitting: it adapts too well to the training data, but generalises badly to data it has not seen before. To reduce this variance, there are various strategies that we can adopt, which differ mostly from the ones we just saw to reduce bias. These strategies are:
- Get more labelled data: if our model ins’t generalising well in some cases, maybe it is because it has never seen those kind of data instances in the training, and therefore getting more training data could be of great use for model improvement.
- Trying data augmentation: if getting more data is not possible, then we could try data augmentation techniques. With images this is a pretty standard procedure, done by rotating, cropping, RGB shifting and other similar strategies.
- Use regularisation: there are techniques that are specifically conceived for reducing over-fitting, like L1 and L2 regularisation, or Dropout in the case of Artificial Neural networks.
After this, we would have also managed to reduce our variance! Awesome, now we have optimised our Machine Learning model to its full potential.
Conclusion and additional Resources
That is it! As always, I hope you enjoyed the post, and that I managed to help you understand the keys to evaluating Machine learning models and their performance.
If you’re looking for great books to complement what you have learnt in this article check out the following reviews:
- Data Science in Production by Ben Weber.
- Feature Engineering for Machine Learning
- Generative Deep Learning by David Foster
For even more check out our awesome Machine Learning books category or our Online Courses Category!
Thanks a lot for reading, don’t forget to follow us on Twitter and have a great day!

Tags: Evaluating Machine Learning models, Model Evaluation, Evaluation Metrics in Machine learning, Debugging machine learning models, Performance metrics in machine learning.
Subscribe to our awesome newsletter to get the best content on your journey to learn Machine Learning, including some exclusive free goodies!
