
The coolest Python Confusion Matrix Code out there
This article has, the code, which in our opinion plots the coolest and most understandable confusion matrix in Python all packed in a single, easy to understand function. This code is taken from Sklearns Website and modified a little bit to make it easier to read and use.
You can find an article explaining what Sklearn is here, and also describing the Confusion Matrix is here.
# Confusion Matrix plotting function
def plot_confusion_matrix(cm, classes,
                          normalize=False,
                          title='Confusion matrix',
                          cmap=plt.cm.Blues):
    """
    This function prints and plots the confusion matrix.
    Normalization can be applied by setting `normalize=True`.
    """
    plt.imshow(cm, interpolation='nearest', cmap=cmap)
    plt.title(title)
    plt.colorbar()
    tick_marks = np.arange(len(classes))
    plt.xticks(tick_marks, classes, rotation=45)
    plt.yticks(tick_marks, classes)

    if normalize:
        cm = cm.astype('float') / cm.sum(axis=1)[:, np.newaxis]

    thresh = cm.max() / 2.
    for i, j in itertools.product(range(cm.shape[0]), range(cm.shape[1])):
        plt.text(j, i, cm[i, j],
                 horizontalalignment="center",
                 color="white" if cm[i, j] > thresh else "black")

    plt.tight_layout()
    plt.ylabel('Observación')
    plt.xlabel('Predicción')
Using the code is very easy. The parameters to the function are:
- cm: the confusion matrix from Sklearn Metrics, imported as from sklearn.metrics import confusion_matrix. You can find a link to the code examples here.
- classes: the name of the classes in out data in an array. In the example bellow we have are classifying the MINST dataset, so we pass it the array [0,1,2,…,9]. If we had a classifier for detecting dogs and cats, and dog was a 0 and cats a 1, we would pass it [‘Dog’, ‘Cat’]
- normalize: if we want normalization or not. By default this is False
- title: the title of our plot
- cmap: the color map of the plot. You can find all the available colour maps here.
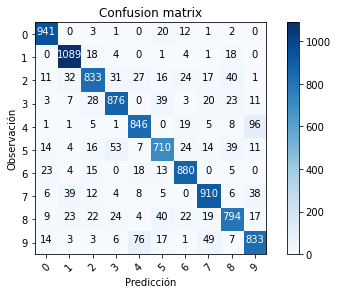
Finally, you use the code like so, getting an output like shown in the following figure for a 10 class problem.
# This is the Sklearn Confusion Matrix code
confusion_mtx = confusion_matrix(Y_true, Y_pred_classes)
# plot the confusion matrix
plot_confusion_matrix(confusion_mtx, classes = range(10))
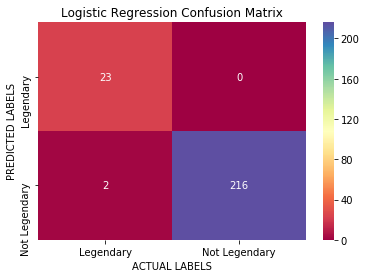
If only had two classes, you would get something like this (with a different colour map, and the classes ‘Legendary‘ and ‘Not Legendary‘:
That is it, hope you make good use of this quick code snippet for the Python Confusion Matrix and its parameters! Follow us on Twitter here! Also, if you have any doubts or comments, please feel free to contact us at howtolearnmachinelearning@gmail.com.
Spread the love and have a fantastic day 🙂
No products found.
Tags: Python Confusion Matrix, Confusion Matrix Python, Sklearn Confusion Matrix, Confusion Matrix Code.
Subscribe to our awesome newsletter to get the best content on your journey to learn Machine Learning, including some exclusive free goodies!
