

Learn why Feature Scaling is a fundamental part of building an unsupervised learning model with a clear example!
When approaching almost any unsupervised learning problem (any problem where we are looking to cluster or segment our data points), feature scaling is a fundamental step in order to asure we get the expected results.
Forgetting to use a feature scaling technique before any kind of model like K-means or DBSCAN, can be fatal and completely bias or invalidate our results.
In this post we will explore why, and lay out some details and examples.
Lets go!
What is unsupervised learning?
Unsupervised learning is the name of a family of Machine Learning models that can segment, group, and cluster data all without needing an specific label or target variable. It is used for tasks like customer segmentation for marketing campaigns, or grouping similar houses together in a rental property classification model.
The main takeaway is that it can group and segment data by finding patterns that are common to the different groups, without needing this data to have an specific label.
In unsupervised learning, we have to analyse the output ourselves and extract valuable insights from it.
You can learn more about the different kinds of learning in Machine Learning (Supervised, Unsupervised and Reinforcement Learning in the following post): Supervised, Unsupervised and Reinforcement Learning.
Also, check out our Tutorials category for more related information.
What is feature scaling?
Feature scaling is a family of statistical techniques that, as it name says, scales the features of our data so that they all have a similar range. You will best understand if we see a quick example:
Imagine we have data about the amount of money that our bank clients have, that goes in the 0–1.000.000$, and information about their age, that is in the 18–100 range.
If we apply a feature scaling technique to this data set, it would scale both features so that they are in the same range, for example 0–1 or -1 to 1.
Main feature scaling techniques
The main feature scaling techniques are Standardisation and Normalisation. Lets see what each of them does:
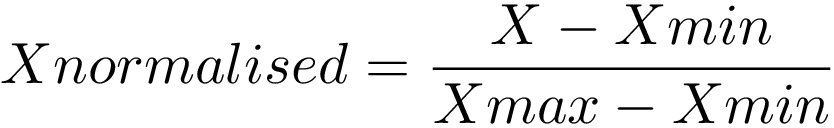
- Normalisation scales our features to a predefined range (normally the 0–1 range), independently of the statistical distribution they follow. It does this using the minimum and maximum values of each feature in our data set, which makes it a bit sensitive to outliers.
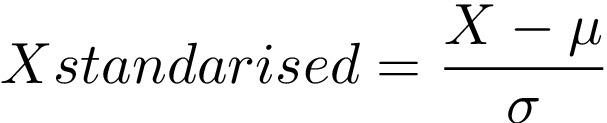
- Standardisation takes our data and makes it follow a Normal distribution, usually of mean 0 and standard deviation 1. It is best to use it when we know our data follows an standard distribution or if we know there are many outliers.
In the Sklearn Feature Scaling jargon, these two techniques are called StandardScaler and MinMaxScaler.
Awesome, now that we know what feature scaling is and its most important kinds, lets see why it is so important in unsupervised learning.
Why is feature scaling important?
Feature scaling is specially relevant in machine learning models that compute some sort of distance metric, like most clustering methods like K-Means.
Why? These distance metrics turn calculations within each of our individual features into an aggregated number that gives us a sort of similarity proxy. They take the raw features of our data with their implicit value ranges.
The most well known distance metric is the Euclidean distance, which formula is as following:
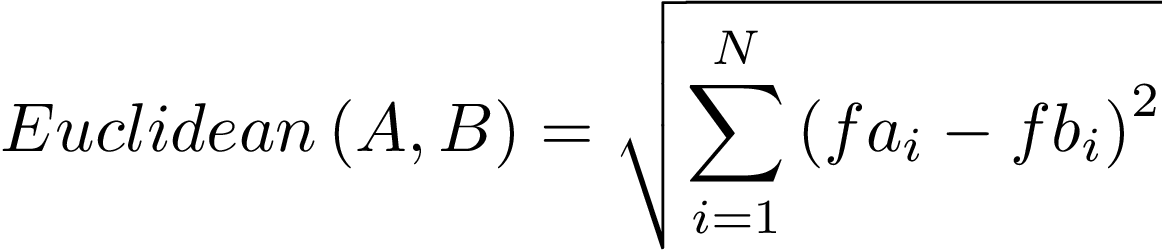
From this formula we can easily see what the euclidean distance computes: It takes two data points, calculates the squared difference of each of the N features, sums them, and then does the square root.
Image the previous example where we had bank deposits and ages. Consider the following two data points:
- Data point A: 125.000$ bank deposit, age 52.
- Data point B: 100.000$ bank deposit, age 45.
Lets compute the euclidean distance for A and B and separate the contribution of each feature:
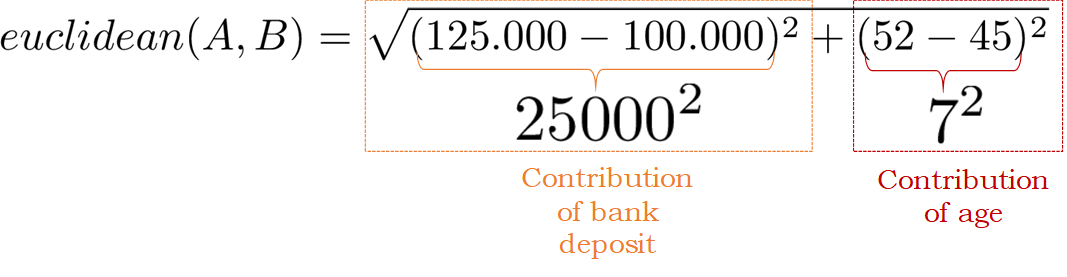
In this case the contribution of the bank deposit feature to the euclidean distance completely dominates versus the contribution of the age feature, and this is not because it is a more important feature to consider. It is just derived from the amazingly big difference in its value range with respect to the age feature.
By using a feature scaling technique both features would be in the same range and we would avoid the problem of one feature dominating over others. Lets wrap this all up with an example of how this influences an unsupervised learning technique.
Read on, as now is where we put it all together and the importance of feature scaling becomes obviously evident!
A visual example: weight and height
Lets go to a different example now.
Imagine we have a Data set with the weights and heights of 1000 individuals. The height is measured in meters, so it goes from 1.4m to 2m approximately. Weight, on the other hand, is measured in Kilograms, so it goes from about 40 to over 120Kg. This is represented in the following scatter plot of the individuals of our data.
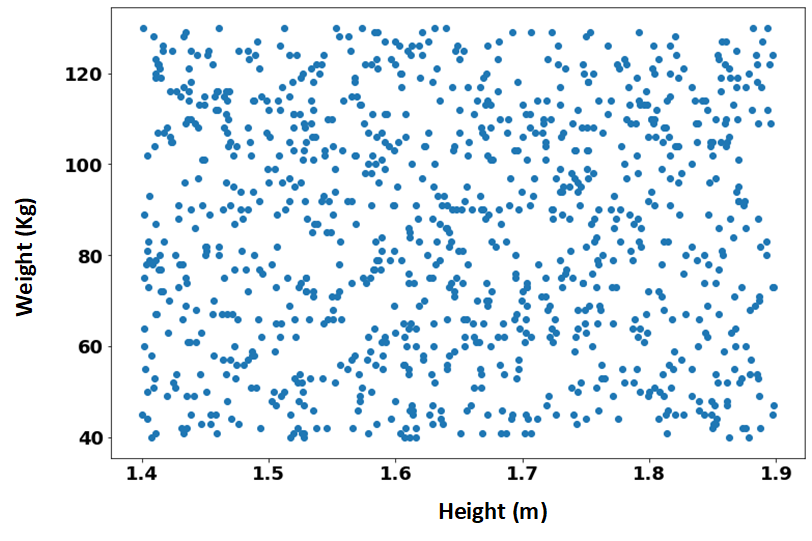
Here we can see again that one feature (weight) has a much larger value range than the other one (height). Lets say that we want to ideally segment our data points into 4 clusters:
- Low weight, low height individuals.
- Low weight, tall individuals.
- High weight, low height individuals.
- High weight, tall individuals.
In order to achieve this we use a k-means clustering algorithm, which computes the euclidean distance to create these 4 clusters. The results we would get are the following, where each color represents a different cluster.
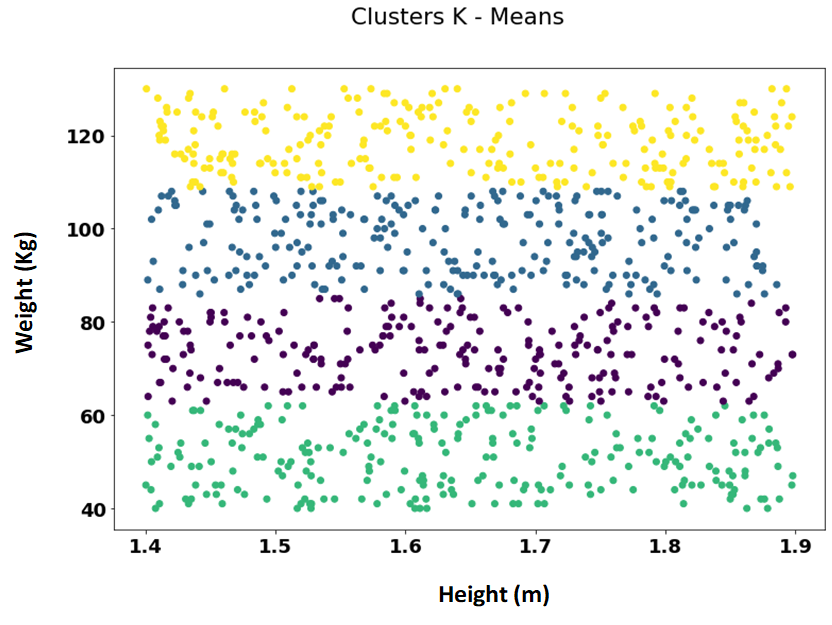
Here we see 4 clusters that are completely different than what we were expecting: individuals are only divided with regards to their weight — the height had no influence in the segmentation, so we got the following clusters that only consider weight:
- Green cluster: The lowest weight individuals, between 40 and 60 kg aprox.
- Purple cluster: individuals between 60 and 80 kg aprox.
- Blue cluster: individuals between 80 and 105 kg.
- Yellow cluster: data points representing individuals who weight more than 105 kg.
The height of the individual made no difference in the segmentation! Lets fix this by using a feature scaling technique. Our features now, after the feature scaling, (standarisation in this case), have the following look:
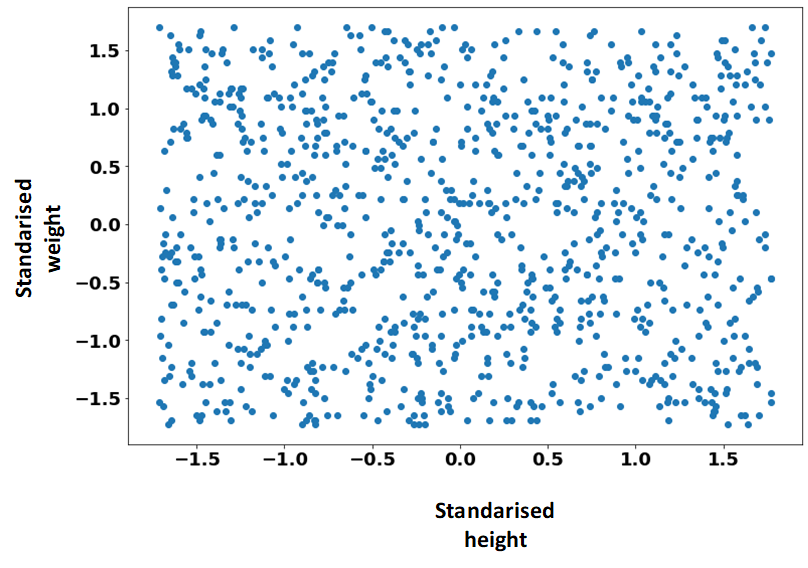
We can see that now both, weight and height have a similar range, in between -1.5 and 1.5, and no longer have an specific metric like Kg or meters associated. Lets apply our clustering again to these new features!

On the scatter plot on the left, we can see our k-means clustering over the standarised features. If we take the clusters assigned by the algorithm, and transfer them to our original data points, we ge the scatter plot on the right, where we can identify the 4 groups we were looking for, correctly dividing individuals with respect to their heights and weights.
Awesome right?
Closing words and other resources
That is it! As always, we hope that you enjoyed the post, that I managed to help you learn a little bit about what is Feature Scaling in Machine Learning, and some of the reasons for using feature scaling.
If you want to go deeper on the topic, check out the following resources:
- Distance Metrics in Machine Learning.
- Feature Scaling in Machine Learning: Understanding the difference between Normalisation and Standarisation.
- Machine Learning Mastery: Rescaling Data for Machine Learning in Python.
Also, you can check out our repository for more resources on Machine Learning and AI!
Find the best Machine Learning books here, and awesome online courses for everybody here!
Tags: Feature Scaling in Machine Learning, Normalisation in Machine Learning, Standarization feature scaling, Feature Scaling in Python.
Subscribe to our awesome newsletter to get the best content on your journey to learn Machine Learning, including some exclusive free goodies!
