
Your business data can help to improve your company’s productivity. You can achieve this using software that can identify essential trends and patterns. It presents information in a relevant way for the same reason.
You can use custom business intelligence (BI) dashboards. These offer a tailored approach to data analysis. They are exceptional data visualization solutions. Unfortunately, some organizations use them without success. These businesses need to understand how to use them to improve data analysis. This post explores how these dashboards can improve data analysis in your organization.
1. Tailored Visualizations
Your business has unique goals, metrics, and KPIs. They are essential for effective decision-making. However, many tools cannot interpret and analyze these details in time. Custom BI dashboards offer the perfect solution.
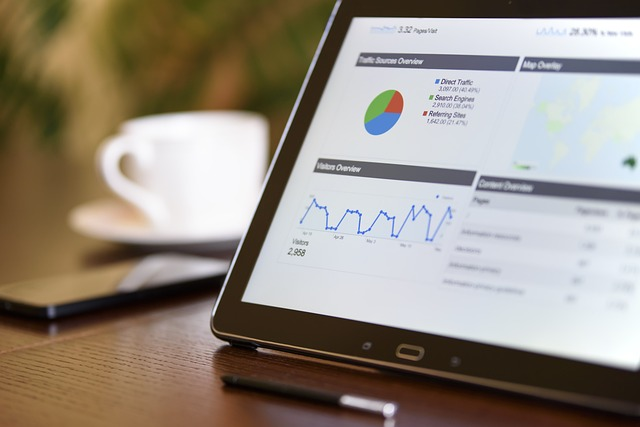
They allow you to design visualization that aligns with your business needs. Imagine using a line chart or simple graph to track sales performance. You see vital details like customer distribution on a single page.
You get the context. When this happens, you can see trends and patterns in the market.
A single number might give you no actionable data. It cannot inform whether you have made profits or losses for successive months. A graph showing how you have performed over a long period will do. When you include historical data, you can see the trend well. Use the information to redefine your target market and products.
Expect a different scenario when viewing raw data. Therefore, the customized dashboards present meaningful data. It does so in a relevant way, simplifying data analysis.
2. Enhanced Interactivity

The experience of your users determines your business success. These dashboards empower your users to interact with critical data. When this happens, exploration and discovery increases. You can use the drill-down functionality or filtering to allow them to delve deeper into the data. These features also empower them to ask questions and uncover critical insights quickly.
The increased interactivity creates a culture that values data-driven decision-making. When many stakeholders engage with the data, you gain valuable insights. You can benefit from their contribution during data analysis. Besides enhanced team spirit, it helps to entrench a culture that enriches data collection and analysis.
3. In-the-Moment Reporting
Businesses understand the essence of using up-to-date data. The business environment is highly dynamic. It changes more frequently than ever. Using old-fashioned tools to access accurate information in time in this environment is impossible. These advanced dashboards generate relevant and essential reports in minutes.
The speed and efficiency ensure you get intuitive reports and data analysis. Due to the efficiency, your managers can implement the required changes at the right time. The customization can empower your team to get the most out of this advanced solution.
4. Scalability and Flexibility
Businesses evolve fast today due to the need to remain competitive. Yours cannot stagnate. As it transforms, your data analysis requirements do the same. These BI dashboards are scalable and flexible. They adapt to your business’s changing needs.
When the data volume increases, the dashboards can handle this change without putting pressure on your resources. At the same time, you can add new data sources with ease. You can also incorporate advanced analytics and expand the scope of your analysis. Irrespective of the required change, you will not require a complete overhaul of your data system. With this agility, you can stay ahead of the curve. It empowers you to leverage data to drive innovation.
5. Integration of Diverse Data Sources
Businesses in the digital age operate across multiple platforms. Some common ones you might be using are CRM systems, marketing analytics tools, and ERP software. Each of these systems generates its data. You need a system that integrates these sources and gives you actionable information.
The BI dashboard can consolidate your data from varied sources into a single platform. When this happens, you get a holistic view of your operations. This process ensures you uncover insights and correlations that you could not see. It fosters a more informed understanding of your business performance.
6. Accessibility of Data Remotely

A Business Intelligence dashboard for data analytics that the cloud powers is available 24/7. It runs online and allows you to interact with everyone on your team. This condition leads to faster deployment. It eliminates the limitations of geographical boundaries. Besides, this increased access ensures your team can access the same customized data concurrently, creating effective communication.
Moreover, the access reduces costly downtime. You save a lot of time without incurring additional charges. When you reduce the service cost, you enable everyone to participate fully in the decision-making. This action can help you to make excellent decisions faster.
The extent of the customization influences how fast you can detect patterns and correlations. You can deploy advanced capabilities like automation to speed up the process further.
Summing Up on Business Intelligence Dashboards
The ability of your customized business intelligence dashboards to offer a tailored approach to data analysis is essential for refining your business. It can help you to achieve improved data analysis by tailoring visualizations and improving interactivity. It can also ensure in-the-moment reporting and scalability.
Besides, these dashboards integrate diverse data sources and increase access to data. As the data landscape evolves, your Business Intelligence dashboards will help you to remain competitive.
Thank you very much for reading How to Learn Machine Learning. We wish you a fantastic day, and keep on learning!
Subscribe to our awesome newsletter to get the best content on your journey to learn Machine Learning, including some exclusive free goodies!